Series: The Sequentia Lectures: Unlocking the Math of AI
Part 1: The Foundation – Thinking Like a Machine
Lecture 3: Data as a Landscape: Visualizing Information in Space
In our last lecture, we discovered how AI translates everything—images, text, sounds—into its universal language: numbers. A single data point, like an email or a picture of a cat, becomes a long list of numbers called a vector.
But what do we do with these lists of numbers? Staring at them doesn’t reveal much. To truly start “thinking like a machine,” we need a powerful mental tool: visualizing data as a landscape.
From a Single Point to a 2D Map
Let’s start with something simple. Imagine we have data about different types of fruit, and for each fruit, we’ve measured just two features: its sweetness (on a scale of 1-10) and its crunchiness (also 1-10).
A single apple might be represented by the vector [Sweetness: 8, Crunchiness: 9].
A single banana might be [Sweetness: 7, Crunchiness: 2].
We can easily visualize this! Using the skills we all learned in school, we can plot these fruits on a simple 2D graph. We’ll make the X-axis “Sweetness” and the Y-axis “Crunchiness.”
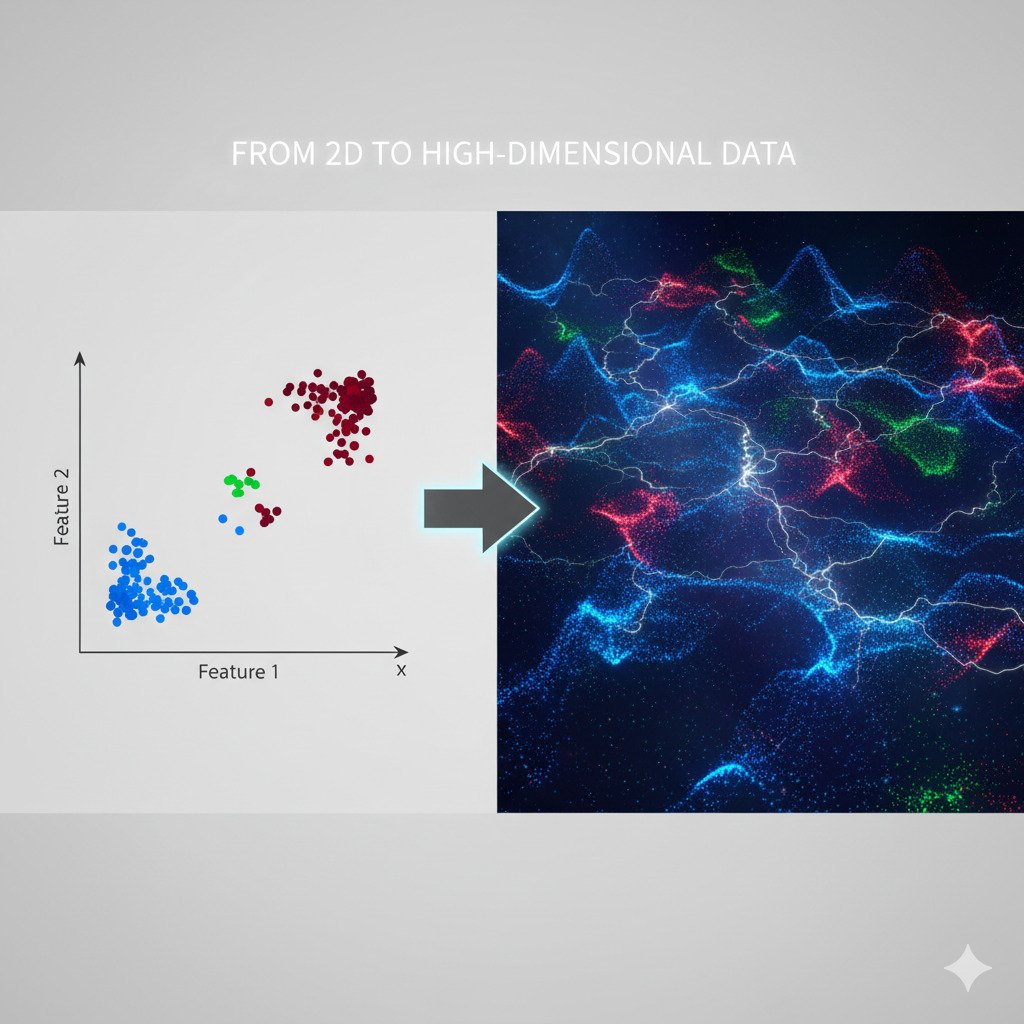
When we plot hundreds of these fruit data points, something magical happens. The points aren’t scattered randomly. They form clusters. Apples will group together in one region of the graph, bananas in another, and lemons in a third. Suddenly, our abstract list of numbers has a visual, geometric shape. We’ve turned our data into a map, or a landscape.
The Leap to Higher Dimensions
This is easy enough for two features (2D). But what if we add a third feature, like juiciness? Our data point for an apple now becomes [Sweetness: 8, Crunchiness: 9, Juiciness: 7]. Our 2D map becomes a 3D “room” or space, and our clusters become floating clouds of points. We can still visualize this in our minds.
But what about real-world AI problems?
- A 100×100 pixel grayscale image has 10,000 features (one for each pixel).
- A word vector representing a single word might have 300 features.
- A user profile for a movie recommendation system could have thousands of features (movies watched, genres liked, time of day, etc.).
We can’t draw a 10,000-dimensional graph. But this is where the power of the landscape analogy comes in. We must imagine that each data point exists as a single point in a vast, high-dimensional space. Even though we can’t see it, the same principles apply: similar data points will be close to each other in this space, and different data points will be far apart.
All the “cat” images will form a giant cluster in one region of this 10,000-dimensional “image landscape.” All the “dog” images will form another cluster nearby, but distinct from the cats.
Finding Patterns in the Landscape
Once we frame data in this geometric way, the goal of AI becomes much more intuitive. Machine learning algorithms are essentially tools for navigating and understanding the geography of this high-dimensional landscape.
- Classification (e.g., Cat vs. Dog): This is like drawing a “fence” or a boundary in the landscape that separates the “cat cluster” from the “dog cluster.” When a new, unknown image-point appears, the model just checks which side of the fence it’s on.
- Clustering (e.g., Grouping Customers): This is like identifying the natural “continents” or “islands” of data points in the landscape without any pre-existing labels.
- Regression (e.g., Predicting House Prices): This is like finding a smooth “pathway” or “surface” that runs through the data points, allowing you to predict where a new point should lie on that surface.
By turning numbers into points and collections of points into a landscape, we transform an abstract mathematical problem into a concrete geometric one. The job of the AI is to be a cartographer and a navigator, discovering the hidden continents, drawing the borders, and charting the pathways within this immense universe of data.
This geometric intuition is one of the most powerful concepts in all of machine learning. In our next lecture, we’ll take our first step as navigators and use the simplest tool possible—a straight line—to start drawing our first boundary.
