Series: The Sequentia Lectures: Unlocking the Math of AI
Part 4: The AI Toolkit: Probability & Statistics
Lecture 27: Conditional Probability: How New Information Changes Our Beliefs
In our last lecture, we defined probability as a way to quantify our belief in an outcome. But our beliefs are not static. They should, and do, change as we receive new evidence. If you hear thunder in the distance, your belief in the “chance of rain” goes up. If you see a clear blue sky, it goes down.
The mathematical framework for updating our beliefs in light of new information is called conditional probability. It’s one of the most important ideas in all of statistics and a cornerstone of how AI models “learn” from data.
The Core Idea: P(A | B)
Conditional probability is represented by the notation P(A | B). This is read as:
“The probability of event A happening, GIVEN THAT we know event B has already happened.”
The vertical bar | means “given that” or “on the condition of.” We are no longer calculating the probability of A in a vacuum; we are calculating it within the new, smaller universe where B is a known fact.
An Intuitive Example: Drawing Cards
Let’s use a standard deck of 52 cards.
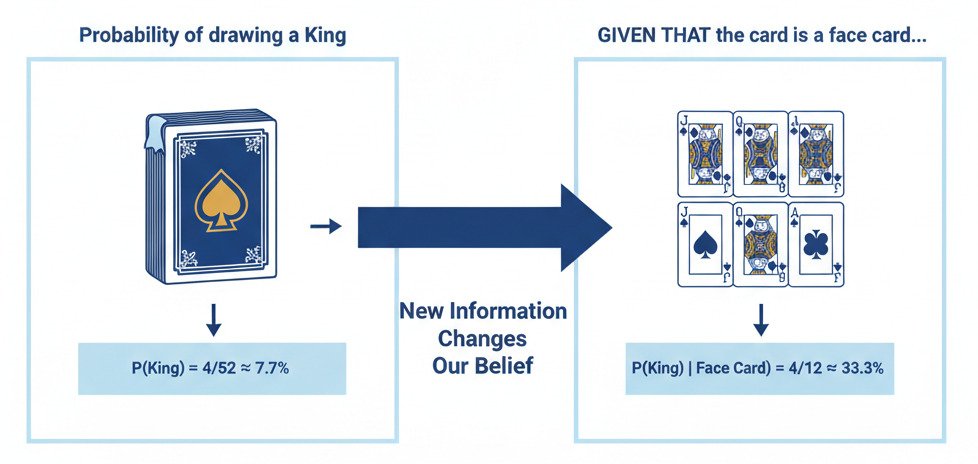
- Question 1 (Simple Probability): What is the probability of drawing a King?
- There are 4 Kings in a 52-card deck. So, P(King) = 4/52 ≈ 7.7%.
Now, let’s introduce a new piece of information.
- Question 2 (Conditional Probability): I draw a card and look at it. I tell you, “The card I drew is a face card (Jack, Queen, or King).” Given this new information, what is the probability that the card is a King?
- We are no longer considering all 52 cards. Our “universe” of possibilities has shrunk to only the face cards.
- How many face cards are there? 12 (4 Jacks, 4 Queens, 4 Kings).
- How many of those are Kings? 4.
- So, the probability of the card being a King, given that it is a face card, is P(King | Face Card) = 4/12 = 1/3 ≈ 33.3%.
Notice how our belief (the probability) jumped from 7.7% to 33.3% as soon as we received new, relevant evidence. This is conditional probability in action. The new information constrained our space of possibilities, allowing for a more refined prediction.
The Formal Definition
The formula for conditional probability is:
P(A | B) = P(A and B) / P(B)
In words: “The probability of A given B is the probability of both A and B happening together, divided by the probability of B happening.”
Let’s check this with our card example:
- P(King and Face Card): The probability of a card being both a King and a face card. Since all Kings are face cards, this is just the probability of being a King, which is 4/52.
- P(Face Card): The probability of drawing any face card, which is 12/52.
- P(King | Face Card) = (4/52) / (12/52) = 4/12 = 1/3. The formula works!
Conditional Probability as the Engine of Learning
This simple idea is the mathematical basis for how AI models learn from data. Every piece of data we feed into a model is a new piece of evidence that updates the model’s “beliefs.”
- Spam Filtering: A model starts with a general probability that an email is spam, P(Spam). When it sees a new piece of evidence (e.g., the email contains the word “lottery”), it updates its belief by calculating P(Spam | contains “lottery”). This new probability will be much higher. It then sees more evidence (e.g., the sender is unknown) and updates again: P(Spam | contains “lottery” AND unknown sender). Each new feature updates the probability.
- Medical Diagnosis: A diagnostic AI might start with the general probability of a patient having a certain disease, P(Disease). As it receives new test results (evidence), it continually updates its belief: P(Disease | positive blood test), then P(Disease | positive blood test AND high fever).
The entire process of “learning” can be viewed as a continuous cycle of updating conditional probabilities. The model starts with a general set of beliefs about the world (its initial parameters) and refines them with every single data point it observes, getting more and more accurate as its “conditions” become more and more specific.
Conditional probability is the tool that allows our models to be dynamic, to react to new information, and to move from a state of general uncertainty to one of specific, evidence-based belief.
