In the world of AI, more data is often better. But what about more features? When our data has hundreds or thousands of features—from every pixel in an image to every possible user interaction on a website—we can run into a problem known as the “curse of dimensionality.” High-dimensional data can be computationally expensive, slow to process, and often contains redundant or noisy information that can confuse our AI models.
So, how can we simplify our data without throwing away its essential meaning? This is where a powerful technique called Principal Component Analysis (PCA) comes in. It’s a method for intelligently “squashing” our data into a lower dimension while preserving its soul—the most important information.
The Problem: A ‘Flat’ Cloud in a 3D Room
Imagine our data is a cloud of points in a 3D room. But when we look at it, we notice something interesting: the cloud isn’t a big, puffy sphere. It’s almost completely flat, like a sheet of paper or a pancake tilted in the room.
While each data point technically has three coordinates (X, Y, Z), do we really need all three to describe its position? If we could just find the 2D plane that this “pancake” of data lies on, we could describe every point using just two coordinates on that plane without losing much information at all. We would have successfully reduced the data’s dimensionality from 3D to 2D.
This is the core intuition behind PCA.
Finding the ‘Most Important’ Directions with Eigenvectors
In our last lecture, we learned that eigenvectors point in the directions of highest variance in our data—the directions along which our data cloud is most “stretched out.” The corresponding eigenvalue tells us how much it’s stretched in that direction.
Principal Component Analysis leverages this idea directly:
- Analyze the Data’s Shape: PCA starts by calculating a special matrix from our data (the covariance matrix) that describes its shape and orientation.
- Find the Principal Components: It then calculates the eigenvectors and eigenvalues of this matrix.
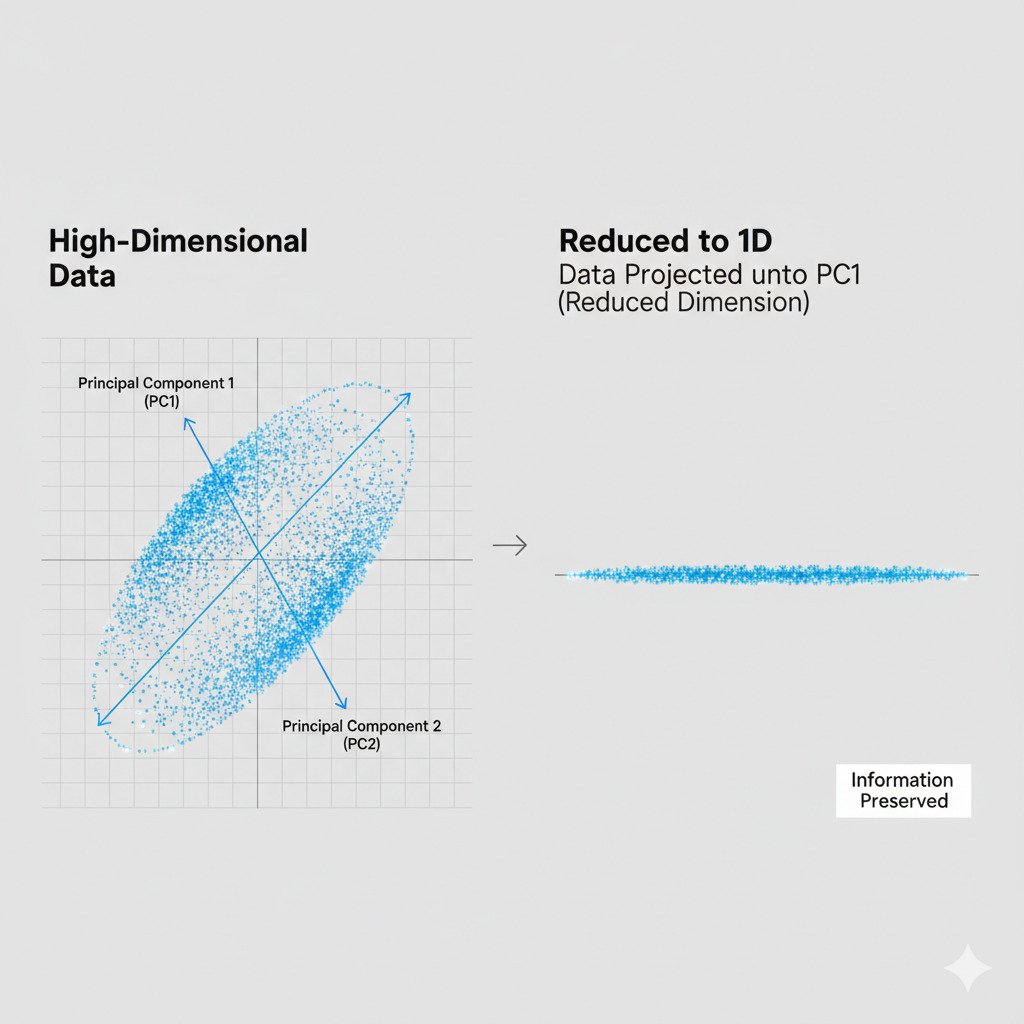
- The eigenvector with the largest eigenvalue is the First Principal Component (PC1). This is the single most important direction in our data—the longest axis of our data cloud.
- The eigenvector with the second-largest eigenvalue is the Second Principal Component (PC2). This is the next most important direction, perpendicular to the first.
- This continues for as many dimensions as we have.
These principal components are the new “axes” that perfectly describe the orientation of our data landscape.
Projecting the Data: Casting a Shadow
Once we’ve identified these most important directions (our principal components), we can perform the “squashing” or dimensionality reduction.
This is done through a process of projection. Imagine our 3D “pancake” of data and the 2D plane we found that describes it. To reduce the data to 2D, we essentially “project” each 3D point onto that 2D plane, like casting a shadow. We discard the now-useless third dimension (the distance from the plane, which is tiny) and keep only the new 2D coordinates.
If we have 1000-dimensional data, PCA might discover that the first 5 principal components capture 98% of the information (variance). We can then project our 1000-dimensional data points onto the 5-dimensional “subspace” spanned by these top 5 eigenvectors. We’ve just squashed our data from 1000 dimensions down to 5, making it vastly easier to work with, while only losing 2% of its “soul.”
Why is PCA So Useful?
- Speeding Up AI Models: Training a model on 5 features is dramatically faster than training on 1000.
- Noise Reduction: By focusing only on the directions of highest variance, PCA can filter out noise that might exist in the less important dimensions.
- Data Visualization: This is one of its most powerful uses. We can’t visualize 1000-dimensional data. But by using PCA to project it down to its two or three most important principal components, we can create a 2D or 3D scatter plot that reveals the underlying structure, clusters, and patterns of our original, high-dimensional data.
PCA is a beautiful application of linear algebra, allowing us to take overwhelmingly complex data and find its simple, elegant essence. It’s the ultimate tool for a data cartographer, helping us draw a simple map of a complex world.
