Series: The Sequentia Lectures: Unlocking the Math of AI
Part 2: The AI Toolkit: Linear Algebra
Lecture 12: Linear Independence & Span: The ‘Space’ Your Data Lives In
We’ve learned to see our data as vectors—points in a vast, high-dimensional landscape. But is every feature in our data providing new, useful information? And what are the boundaries of the “world” that our data can actually describe?
To answer these questions, we need to understand two related and powerful concepts from linear algebra: Linear Independence and Span.
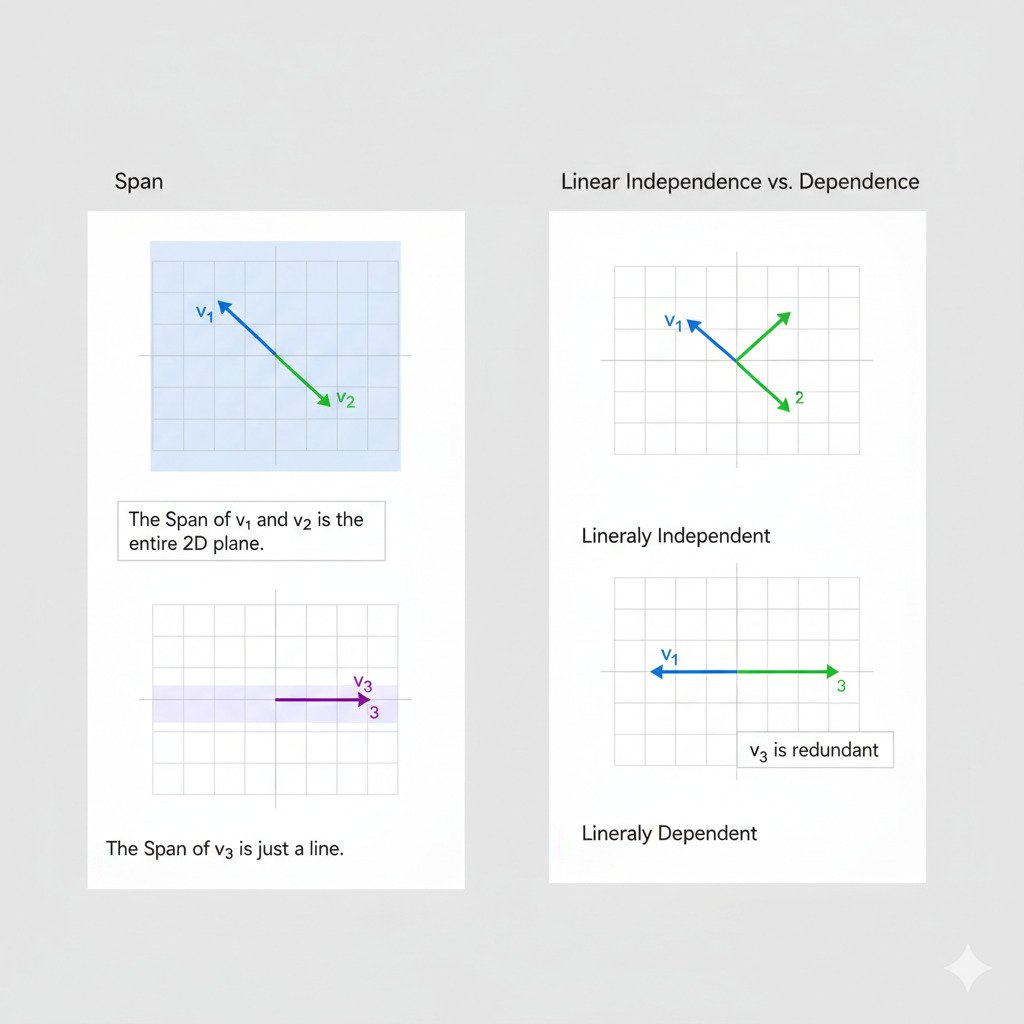
Span: The Universe Your Vectors Can Create
Imagine you’re standing at the origin (0,0) on a 2D graph, and you’re given a single vector, let’s call it v₁ = [2, 1]. This vector points up and to the right.
What places can you reach if you can only travel along the direction of v₁? You can travel along v₁ once, twice (2*v₁), half-way along it (0.5*v₁), or even backwards along it (-1*v₁). By scaling v₁ by any number, you can reach any point on the infinite line that passes through the origin and v₁. This line is the “span” of the vector v₁.
Now, what if I give you a second vector, v₂ = [-1, 2], which points in a different direction? You can now travel some amount along v₁ and some amount along v₂. By combining these two movements (a process called a “linear combination”), you can now reach any point in the entire 2D plane. The plane is the span of the vectors v₁ and v₂.
The span of a set of vectors is the set of all points that can be reached by adding and scaling those vectors. It defines the “universe” or the “subspace” that your data vectors can possibly inhabit.
Linear Independence: Is Your Data Redundant?
Let’s go back to our second example. We had two vectors, v₁ = [2, 1] and v₂ = [-1, 2]. Adding v₂ gave us access to a whole new dimension of movement, allowing us to span the entire 2D plane. We say that v₁ and v₂ are linearly independent because neither one can be created by simply scaling the other; they each provide unique directional information.
But what if our second vector was v₃ = [4, 2]? This vector points in the exact same direction as v₁; in fact, v₃ = 2 * v₁. If we add v₃ to our set, does it allow us to reach any new places? No. Any movement we can make with v₃ we could already make with v₁. The vector v₃ is redundant.
We say that v₁ and v₃ are linearly dependent. A set of vectors is linearly dependent if at least one of the vectors in the set can be created by a linear combination (adding and scaling) of the others.
Why This Matters for AI
These concepts might seem abstract, but they have direct, practical implications for machine learning.
- Feature Redundancy: When we prepare data for an AI model, our features are the columns of our data matrix. If two features are linearly dependent, it means one of them is providing no new information. For example, if we have a feature for “temperature in Celsius” and another for “temperature in Fahrenheit,” they are linearly dependent. One can be perfectly predicted from the other. Including both can sometimes make the learning process less stable or efficient. Identifying and removing this redundancy (a form of “feature selection”) is an important step.
- Dimensionality of Data: The number of linearly independent vectors in a set gives you the true “dimensionality” of the space they span. If you have a dataset with 50 features, but only 30 of them are linearly independent, your data actually lives in a 30-dimensional “subspace” within the larger 50-dimensional space. This insight is the foundation of techniques like Principal Component Analysis (PCA), which aim to find the most important, independent directions in our data landscape.
- Solvability of Problems: In some classical machine learning models (like simple linear regression), if your feature matrix has columns that are linearly dependent, it can make it mathematically impossible to find a single, unique solution. The model becomes “ill-conditioned,” meaning there are infinitely many possible “right” answers, and the algorithm can’t choose.
Understanding span and linear independence helps us reason about the very fabric of our data landscape. It tells us how much “space” our data actually occupies and whether the “directions” (features) we’re using to describe it are efficient and unique. It’s a way to check for echoes and redundancies, ensuring that our AI is learning from a signal that is as clear and informative as possible.
